P-value graph
pValue.RdP-value graph to determine threshold for marker clustering
Usage
pValue(dist = seq(25,40, by = 5), pop.size = 100:500,
       map.function = "kosambi", LOD = FALSE)
Arguments
- dist
Numeric range of genetic distances in cM.
- pop.size
Numeric range of population sizes.
- map.function
Character string of either
"kosambi","haldane","morgan"or"cf"defining the mapping function to be used.- LOD
If
LOD = TRUEthe LOD score of linkage is calculated or ifLOD = FALSEthen the minus log10 p-value used to threshold the hoeffding inequality is calculated (defaults toFALSE).
Details
This function provides the ability to create a user specified p-value
plot, as discussed in vignette("ASMap").
Value
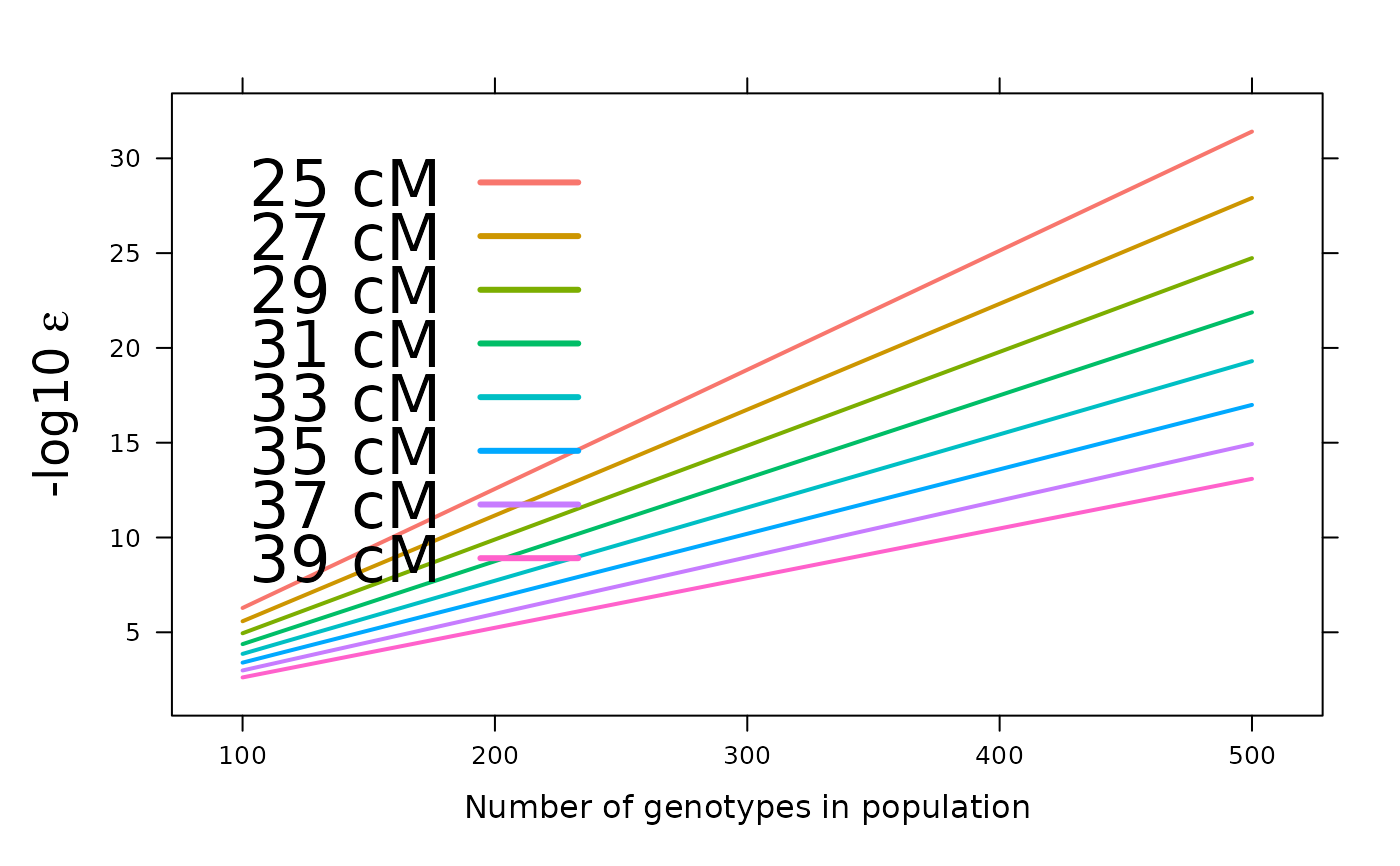
A plot is displayed showing minus log10 pvalue (or LOD score) of linkage vs the range of specified population sizes for different specified genetic distances.
References
Taylor, J., Butler, D. (2017) R Package ASMap: Efficient Genetic Linkage Map Construction and Diagnosis. Journal of Statistical Software, 79(6), 1–29.
Examples
pValue(dist = seq(25, 40, by = 2))